Vulnerability of water resources as a result of land use changes in the Lake Sibaya Catchment
Contents
Last updated: 28 February 2023 | Authors: Keneilwe Hlahane, Marc Pienaar.
Overview
Lake Sibaya is South Africa’s largest freshwater lake with a surface area of 60 -70 km². The lake is located in KwaZulu Natal Province, Maputaland Coastal Plain area, on the east coast of South Africa as shown in Figure 1. The lake is known for its high levels of biodiversity and endemic species, which make it a landscape of both national and international importance, and is also listed as a RAMSAR Wetland of International importance (Southern Africa’s Ramsar Sites, 2022).
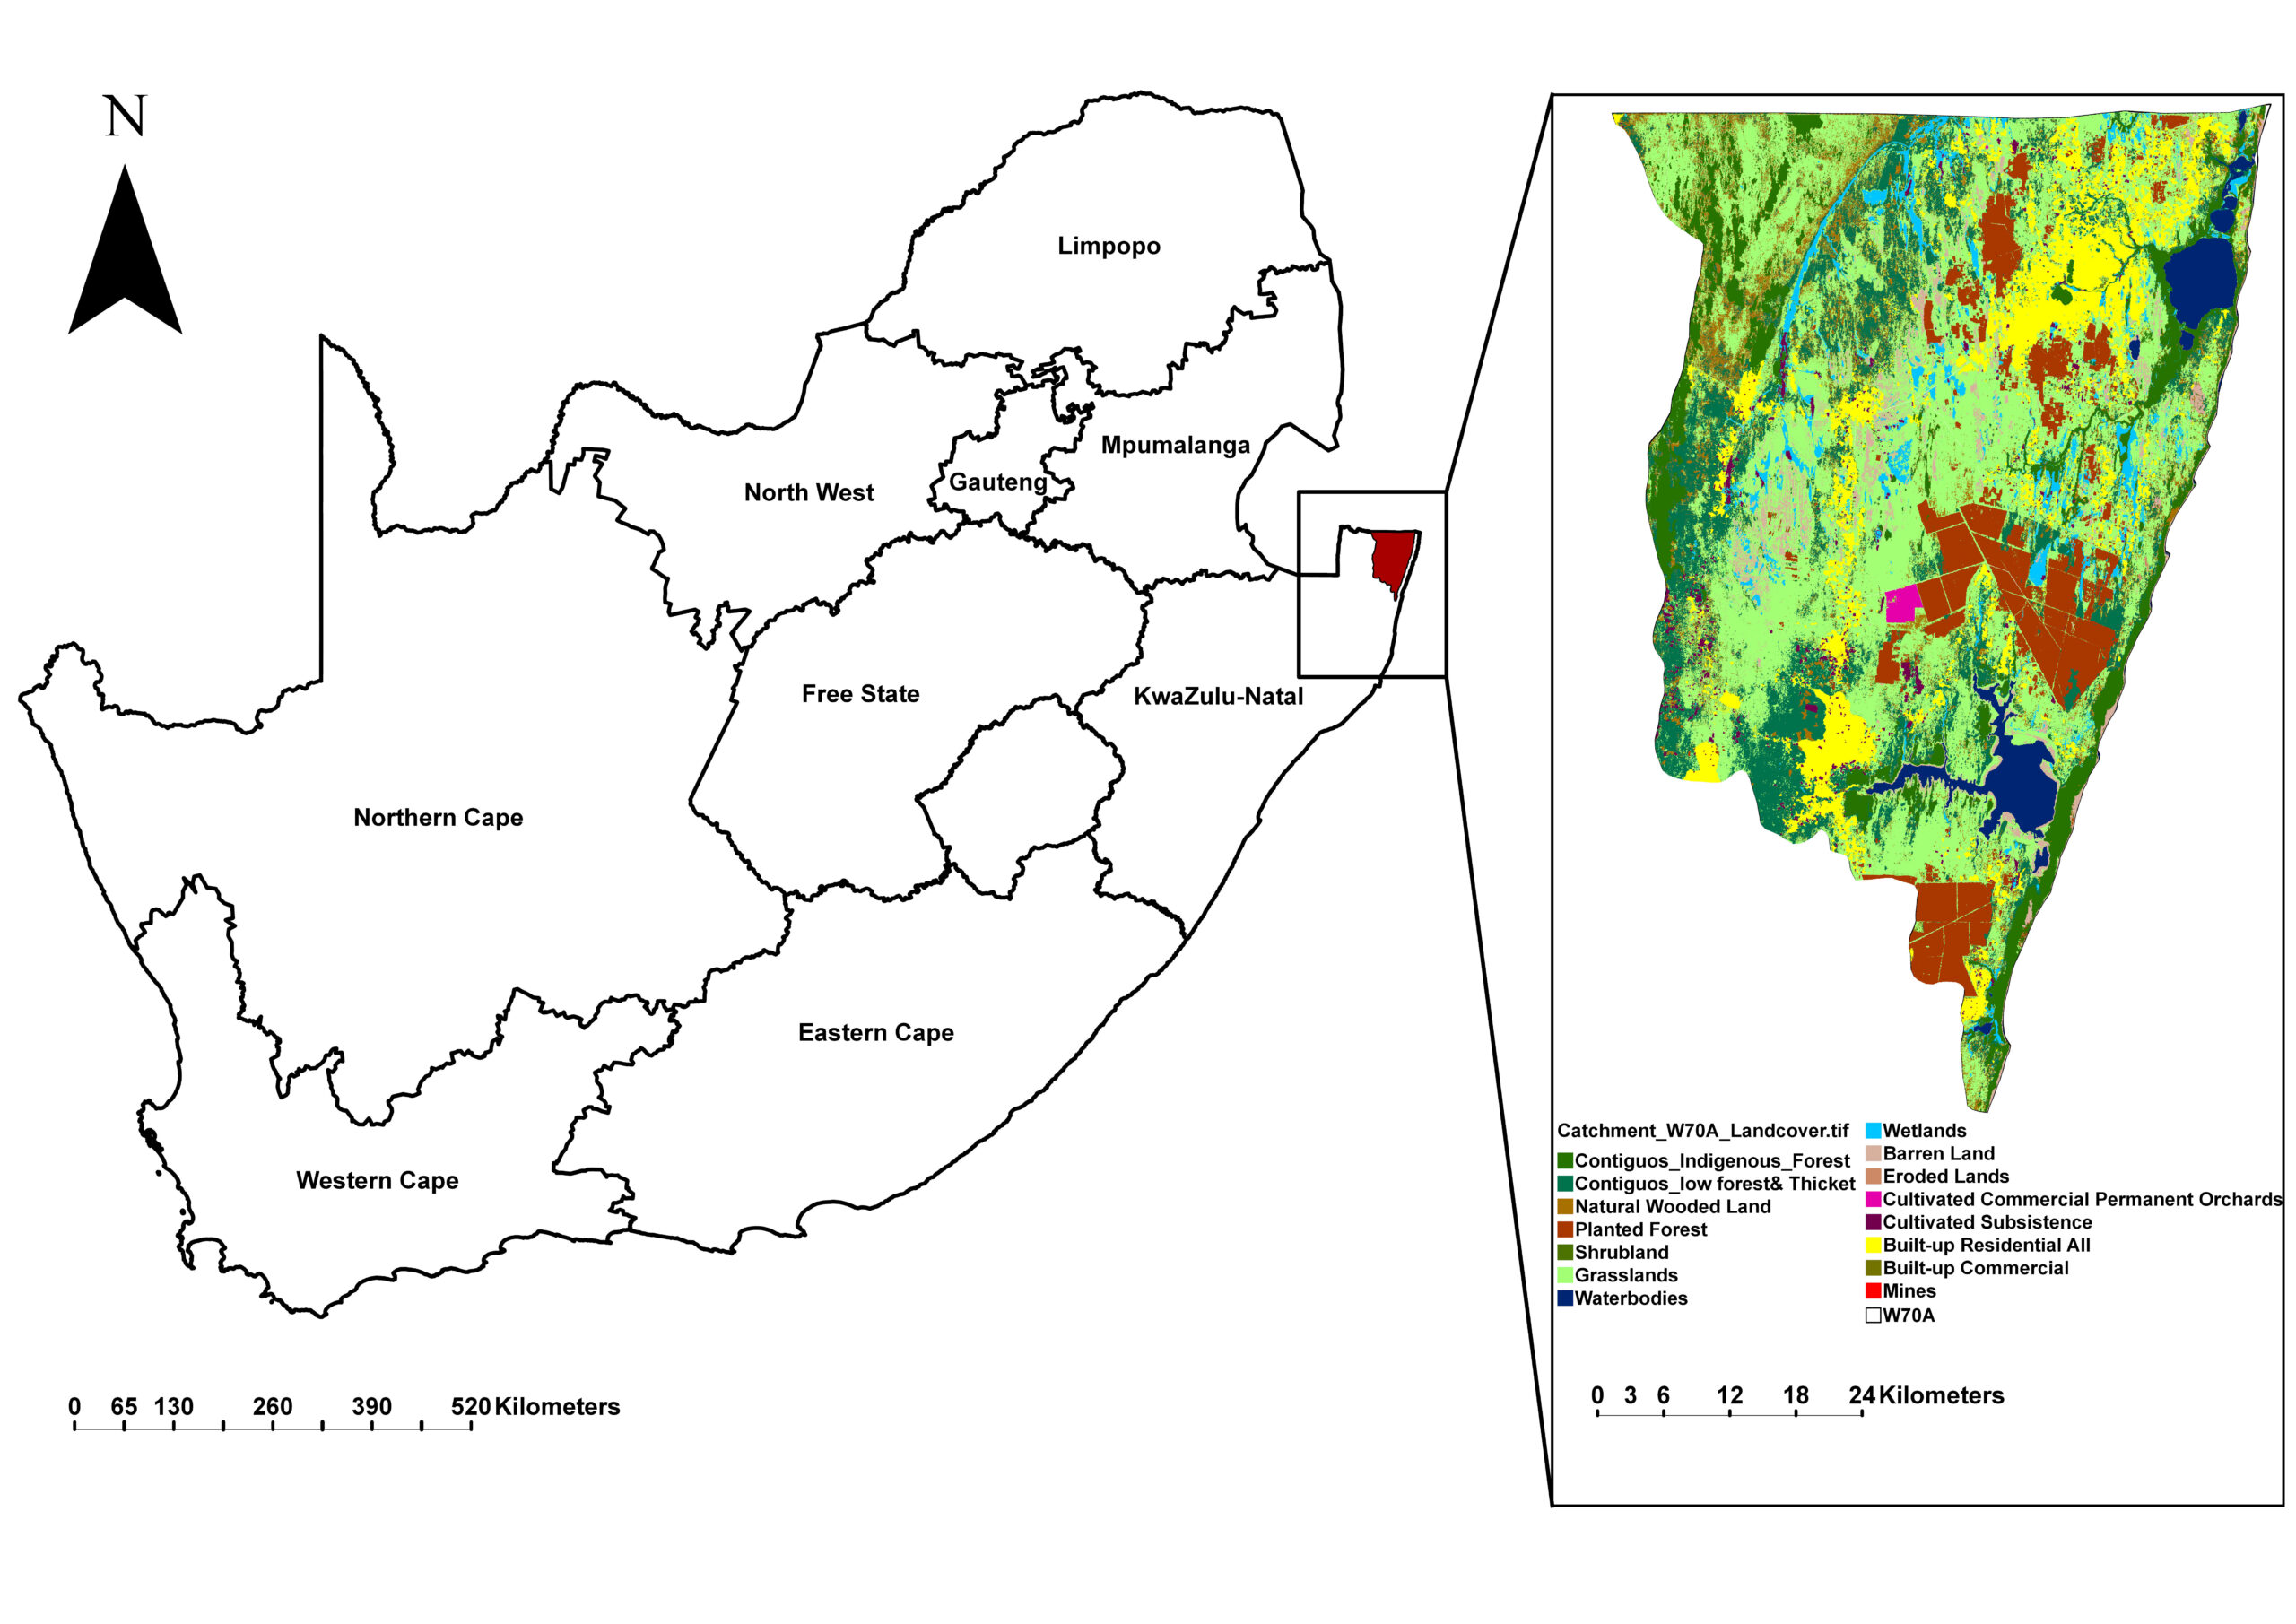
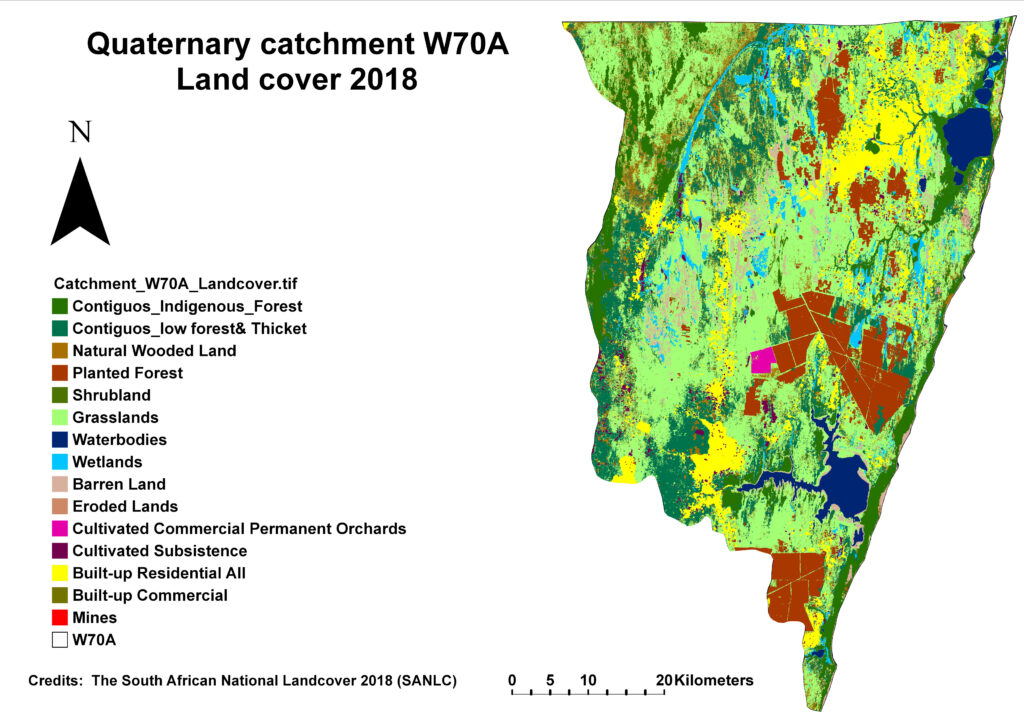
The Lake Sibaya groundwater catchment area is located within Quaternary catchment W70A(Figure 2), a distinctive groundwater-driven system that does not receive water from surface rivers. The system is reliant on localized rainfall for recharge. This groundwater resource area, on which local communities rely, has been declining over the last 20 years. The lake reached record low levels during 2014/2015 and continues to decline ( Janse van Rensburg, SJ. 2019a). This has led to conflict over water resources between humans, livestock, and economic activities such as Stream Flow Reduction Activities (SFRA) commercial forestry licensing. The decline of the water has also affected the ecosystem services Lake Sibaya provides in the catchment.
Recent studies have indicated a combination of below-average rainfall and forestry expansion contributes to the area’s water decline ( Weitz & Demlie, 2014; Everson,2019 ). Over the past decades, the area has experienced significant changes in land use such as the expansion of agriculture, rural settlements, and afforestation. A large proportion of the Lake Sibaya catchment area is covered by plantations (Everson et al. 2019:34; Weitz & Demlie 2014:1). The people in the region are aware that forestry has a negative effect on the water table, but the existing conditions and perceptions make it very difficult to identify and shift toward attractive economic alternatives. This case study draws attention to the environmental, economic, and settlement vulnerability of Lake Sibaya as a result of land use, land cover changes, and climate change.
Lake Sibaya : Land use Land cover change (1990- 2020)
Land use has been changing since people first began to manage their environment. The rate of land use change has implications for the ecosystem services provided by the land. Land management choices have an impact on the water resource, which in turn has feedback on environmental and economic outcomes. The Lake Sibaya case study analyses the impact of land use activities on water resources under changing climatic conditions. Over the past decades, the catchment W70A experienced significant changes in its landscape.
Satellite remote sensing has enabled mapping Land use land Cover (LULC) in a spatially detailed manner that informs policy and land management decisions aimed at achieving global sustainable development goals. This study has analyzed past land use land cover changes between 1990-2020 and their impacts on the water balance in the Lake Sibaya groundwater catchment.
The South African National Landcover was used as an input dataset. The dataset was obtained from the Department of Forestry, Fisheries, and the Environment for the following years 1990, 2014,2018, and 2020. The 1990 and 2014 SANLC was produced using images from Landsat satellite with a spatial resolution of 30m. For the years 2018 and 2020, the SANLC was produced using the European Space Agency satellite Sentinel-2 images, with a spatial resolution of 20m. The images were resampled using a 1 km spatial grid to allow for comparability between Landsat (1990 and 2014) and Sentinel2(2018 and 2020). The SANLC maps have 72 classes that were re-classed and grouped into 22 classes (see Table below) based on the study’s objectives. A bi-temporal change detection method was used for determining land-cover changes by comparing the extent and areas of land-cover classes between two periods. In this study, the years of comparison were 1990 to 2020.
For 1990, the dominant land cover was thickets and dense bush, followed by grasslands and built-up residential areas, covering proportions of 32.8%, 29.15%, and 9.78% of the total area, respectively. Eroded and shrubland was the least dominant classes during this time.
For 2014, grassland increased and became the dominant land cover, followed by thickets and dense bush, and built-up residential areas covering proportions of 35.38%, 25.15%, and 8.97% of the total area. The least dominant classes were cultivated commercial Permanent Orchards and eroded land. Wetlands decreased significantly this year from covering 3% to only covering 0.97% of the total area. Waterbodies also decreased from covering 4.6% to only covering 3.8% of the total area.
For 2018, the dominant land cover was grassland, followed by thickets and dense bush, comprising 38.96% and 14.31% of the total area, respectively. Thickets and dense bush have been showing a decreasing trend over the years while Planted forests have been increasing.
For 2020, the dominant land cover was grassland covering 40% of the total area, followed by built-up residential areas and planted forests each covering 10% of the total area. The least dominant classes were shrubland and cultivated commercial Permanent Orchards.
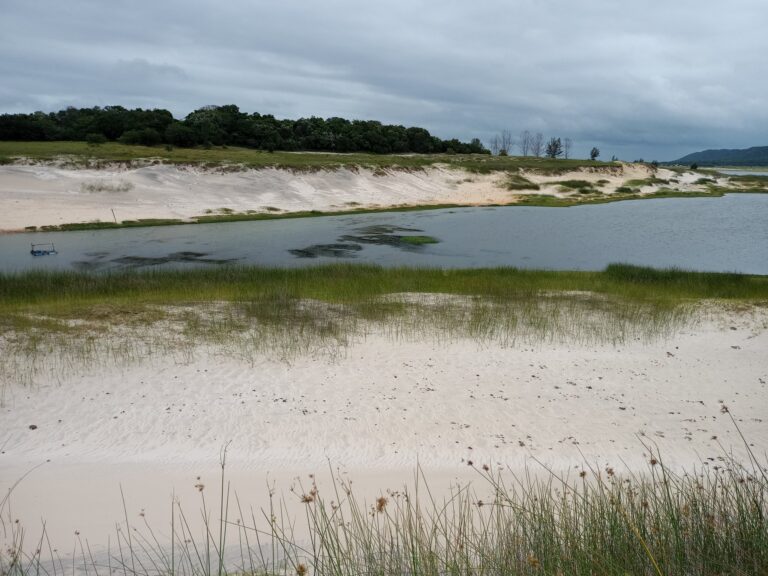
The most significant change was for thicket/dense bush, which decreased from 85094 hectares in 1990 to 19676 hectares in 2020. Waterbodies also decreased from 11940 hectares in 1990 to 8887 hectares in 2020. Lake Sibaya’s water level quickly decreased during the severe 2014–2016 drought, as did the water levels of several other nearby lakes and dams. While Lake St. Lucia and local dams have gradually improved after the drought, Sibaya has not and is continuously declining.
The woodlands also expanded from occupying an area of 15769 ha in 1990 to 23557 ha in 2020, this expansion might potentially be a result of bush encroachment in the area which is negatively affecting the grazing land. Another major change in land use identified was the expansion of forestry plantations, which went from 18836 ha in 1990 to 25819 ha in 2020. These plantations are made up of Pinus and Eucalyptus trees that have a deep-rooted system, which allows the trees to access groundwater. The afforestation in the region has been found to negatively impact hydrological resources in the region. Lake Sibaya is reliant on groundwater for recharge and has consequently been experiencing a significant decline in water levels as a result of low recharge. The decrease is also linked to the deteriorating average annual precipitation and extended dry spells brought on by the changing climate. On this course, the rising threat to water security may deepen poverty in the region as prospects for livelihoods are constrained.
Therefore, there is a need for land-use practices that will support socioeconomic development, while ensuring sustainable management of water resources.
Lake Sibaya: The Maputaland EFTEON Landscape
The Expanded Freshwater and Terrestrial Environmental Observation Network (EFTEON) is a research infrastructure that is being developed under the South African Research Infrastructure Roadmap (SARIR) program of the Department of Science and Innovation (DSI) and is hosted by the South African Environment Observation Network (SAEON).
The EFTEON has selected six sites across the country where ecosystem research will be conducted (FEIG, 2018). Maputaland landscape is one of the areas identified to form part of this ecosystem research. Maputaland is situated in the Indian Ocean Coastal Belt Biome in the northernmost part of the KwaZulu-Natal province. Its high levels of biodiversity and endemic species make it a landscape of both national and international importance (CEPF,2010). The coastal plain represents a low-lying coastal system located within the tropical-to-subtropical climate transition zone and has a distinct hydrological system (Blamey and Reason, 2009 ). EFTEON requires a landscape that fulfills the requirements of a National Research Infrastructure platform and would suit a spatially focused approach. Quaternary catchment W70A was identified as an ideal locality for EFTEON.
Catchment W70A is located in the Pongola-Mtamvuna Water Management Area. This area falls within the Umhlabuyalingana Local Municipality. Catchment W70A is a connected hydrological unit, where the groundwater aquifer is the only available water resource for people and groundwater-dependent ecosystems. The landscape consists of three aquifer-linked coastal lake systems which are Lake Sibaya, the Kosi Lake system, and the uMgobezeleni Estuary system( Kelbe et al,2010).
The Lake Sibaya groundwater catchment was selected as a core focus area for EFTEON long-term observations. The Maputaland EFTEON Landscape would also allow for the formation of a joined terrestrial-aquatic-marine Research Infrastructure platform, due to its spatial alignment with the Oceanographic Research Institute’s (ORI) long-term reef observation sites and the Shallow Marine and Coastal Research Infrastructure (SMCRI) at Sodwana Bay.
Datasets
- SA National Landcover Datasets: https://egis.environment.gov.za/sa_national_land_cover_datasets
Bibliography
- Header Image , Background image photo credit; Photo Credits: iSimangaliso Wetland Park : https://www.exploring-africa.com/en/south-africa/areas-isimangaliso-wetland-park/areas-isimangaliso-wetland-park-sibaya-lake
- Blamey, RC and Reason, CJC. 2009. Numerical simulation of a mesoscale convective system over the east coast of South Africa. Tellus A: Dynamic Meteorology and Oceanography, 61(1): 17-34.
- Carnie, T. 2020. The slow death of Lake Sibaya: Feature-Water Ecosystems. Water Wheel, 19(2): 22-27.
- Critical Ecosystem Partnership Fund (CEPF) (2010). Ecosystem Profile: Maputaland-Pondoland-Albany Biodiversity Hotspot. Conservation International Southern African Hotspots Programme and South African National Biodiversity Institute.
- Everson, CS, Scott-Shaw, BC, Kelbe, BE, Starke, A, Pearton, T, Geldenhuys, C, Vather, T and Maguire, M. 2019. Quantifying the Water-Use of Dominant Land Uses in the Maputaland Coastal Plain. WRC Report, (TT781/18). Water Resources Commission, Pretoria, RSA.
- FEIG, Gregor. 2018. The Expanded Freshwater and Terrestrial Environmental Observation Network (EFTEON). Clean Air J. [online]. 2018, vol.28, n.2 [cited 2022-10-28], pp.27-27. Available from: <http://www.scielo.org.za/scielo.php?script=sci_arttext&pid=S2410-972X2018000200013&lng=en&nrm=iso>. ISSN 2410-972X. http://dx.doi.org/10.17159/2410-972x/2018/v28n2a14.
- Janse van Rensburg, SJ. 2019. Appendix D: Pressures on the Maputaland coastal plain. In: Van Deventer et al. South African National Biodiversity Assessment 2018: Technical Report. Volume 2b: Inland Aquatic (Freshwater) Realm. CSIR report number CSIR/NRE/ECOS/IR/2019/0004/A. South African National Biodiversity Institute, Pretoria, RSA. http://hdl.handle.net/20.500.12143/6230
- Kelbe, Bruce, and Talita Germishuyse.2010. “Groundwater/surface water relationships with specific reference to Maputaland.” Water Research Commission Report 1168/1 (2010): 10.
- Southern Africa’s Ramsar Sites( 2022)http://www.saramsar.com/2015/04/lake-sibaya.html (Accessed 23 January 2023).
- Weitz, J and Demlie, M. 2014. Conceptual modelling of groundwater–surface water interactions in the Lake Sibayi Catchment, Eastern South Africa. Journal of African Earth Sciences, (99):613-624.