COVID-19 Indicators

Download data

View Atlas

Read Report

Providing open access to decision-ready data on the vulnerability of South African communities to COVID-19.

CITATION: Davis-Reddy, C.L., Hilgart, A., Wilson, H., Keebine, G. and Mfopa, C. 2020. COVID-19 Preparedness Indicators: search, visualise, download and create. South African Environmental Observation Network, Pretoria. Available at sarva.saeon.ac.za.

Last updated: 29 July 2021 | Authors: Claire Davis-Reddy, Amelia Hilgart, Hayden Wilson, Galaletsang Keebine, and Caroline Mfopa

Overview

The COVID-19 outbreak started in late 2019 and developed into a global pandemic by March 2020. On 31 December 2019, a cluster of pneumonia cases was reported in Wuhan, Hubei Province, China. On 9 January 2020, China CDC reported a novel coronavirus as the causative agent of this outbreak, which has been named ‘severe acute respiratory syndrome coronavirus 2’ (SARS-CoV-2). The coronavirus disease associated with it is referred to as COVID -19. As of 13 February 2020 more than 60 330 cases of COVID-19 had been reported worldwide with the majority of cases being in China. At this stage, 13 countries had reported local transmission. By 20 March 2020, COVID-19 is affecting 182 countries with 247 593 confirmed cases and 10 064 deaths being reported. The first case in South Africa was confirmed on 6 March 2020 by the National Institute for Communicable Diseases (NICD).  By 20 March 2020, South Africa had reported 202 confirmed cases. The first cases of local transmission were announced on 18 March 2020. 

COVID-19 Data

Summary Statistics for South Africa

Confirmed cases: Country 'South Africa' is invalid.
Deaths: Country 'South Africa' is invalid.

COVID-19 vaccination sites

COVID-19 vaccinations

This is counted as a single dose, and may not equal the total number of people vaccinated, depending on the specific dose regime (e.g. people receive multiple doses). 

Confirmed New Daily Cases

A confirmed case refers to “a person with laboratory confirmation of COVID-19 infection” and is thus only a subset of the total number of actual cases. 

Vulnerability Data

Vulnerability indicators have been identified from publicly available data sources including Health Systems Trust, National Census, 2016 Community Survey, and CSIR’s Green Book.  The spreadsheet provides a list of 52 spatial indicators that can be used to map the potential high risk areas for spread of COVID-19, the vulnerability of people to the diseases, and the ability of the healthcare system to cope with the infected population. The indicators were compiled by a team of data scientists from the South African Environmental Observation Network (SAEON) working on understanding the risk and vulnerability of communities in South Africa to disasters. 

Atlases

COVID-19 Vulnerability Atlas

Collection of datasets compiled by NRF-SAEON mapping the vulnerability of the South Africa to the Covid-19 Pandemic. The datasets included in this application were compiled from a variety of different sources, including Statssa, the CSIR Greenbook as well as the Health System Trust.

View Atlas »

SDG 3 Data Atlas

Decision-ready data in support of health SDGs for South Africa. The data provided is at Local Municipality scale and includes data on HIV, TB, non-communicable diseases, smoking, and health care workers.

View Atlas »

Presentation

5th SAYAS Webinar: 27.11.2020
The South African Young Academy of Science (SAYAS) hosted a Webinar entitled Modelling and Simulation in Medicine: Public Trust in Numbers and COVID-19. 

Infographics

South African hospitals already face a number of challenges that will affect their ability to care for COVID-19 patients. Individuals aged 60+, those with preexisting conditions or those with multiple conditions, and smokers, are most at risk to COVID-19.

Infographics have been developed to aid the understanding of the factors that may amplify the risk of the coronavirus disease (abbreviated as COVID-19) for local communities in South Africa. They have been grouped according to four core themes that focus on (1) potential high risk areas for spread of COVID-19, (2) the vulnerability of individuals, and (3) the ability of the public healthcare system to cope with the infected population.

These sets of infographics make use of the latest publicly available data. Data was sourced from the National Institute for Communicable Diseases (NICD), Health Systems Trust, Global Health Observatory of the World Health Organisation (WHO)National Census, and 2016 Community Survey (abbreviated CS 2016). 

Important Links

National Institute for Communicable Diseases (NICD)

The digital dashboard provides data on how many Covid-19 cases have been recorded. The ward-level data includes a detailed breakdown on infections by age, and the split between male and female.

Word Health Organisation

The World Health Organisation is a leading organisation involved in the global coordination for mitigating the COVID-19 pandemic. The WHO website provides a wide of resources aimed at helping countries respond.

Mapping vulnerability to COVID-19

Statistics South Africa (Stats SA) has released an online mapping tool that shows which communities may be more adversely affected by COVID-19 outbreaks.

COVID-19 Africa Dashboard

This site serves as a monitoring tool of the development of the coronavirus in Africa. This data, in conjunction with global inputs and local parameters, are being used to provide predictions for the spread and impact of the coronavirus in the country. The work is performed by an interdisciplinary team of scientists from Wits University and iThemba LABS of the NRF in collaboration with the data analytics team of DataConvergence.

Coronavirus COVID-19 (2019-nCoV) Data Repository for South Africa

Data Science for Social Impact Research Group at the University of Pretoria has set up a GitHub repository and database that pulls information from the National Institute of Communicable Diseases (NICD) and the Department of Health (DoH).

COVID-19 Global Dashboard

John Hopkins University’s Center for Systems Science and Engineering provides a real-time update on the new COVID-19 confirmed cases, deaths, and recoveries by country, province, and city.

Supporting Datasets

1. District Health Barometer 2007-2019

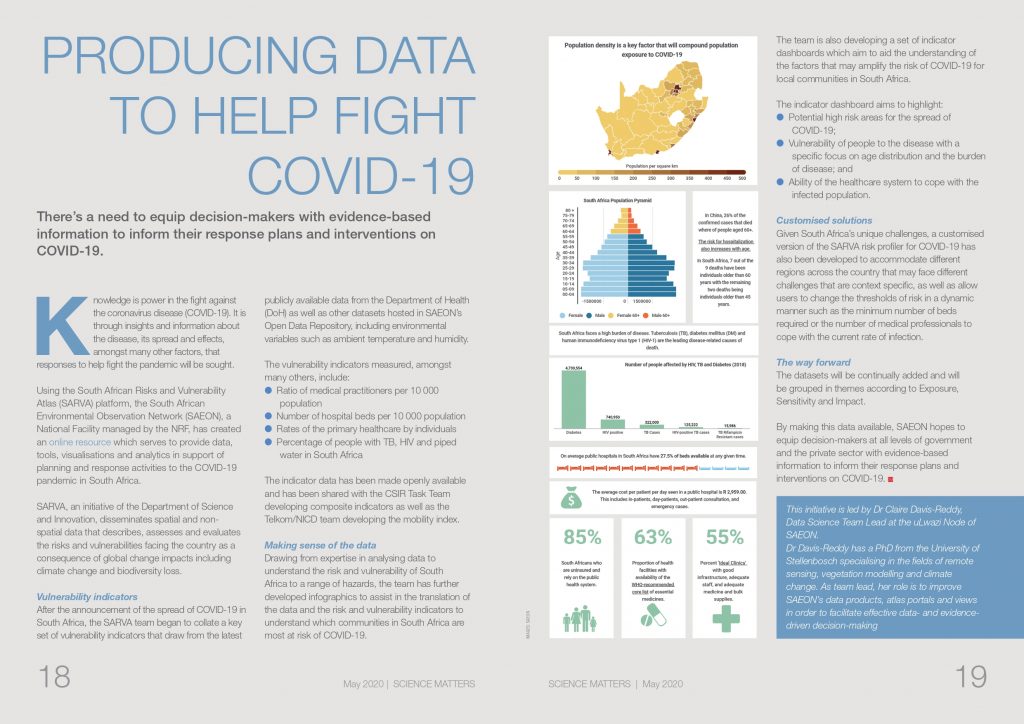
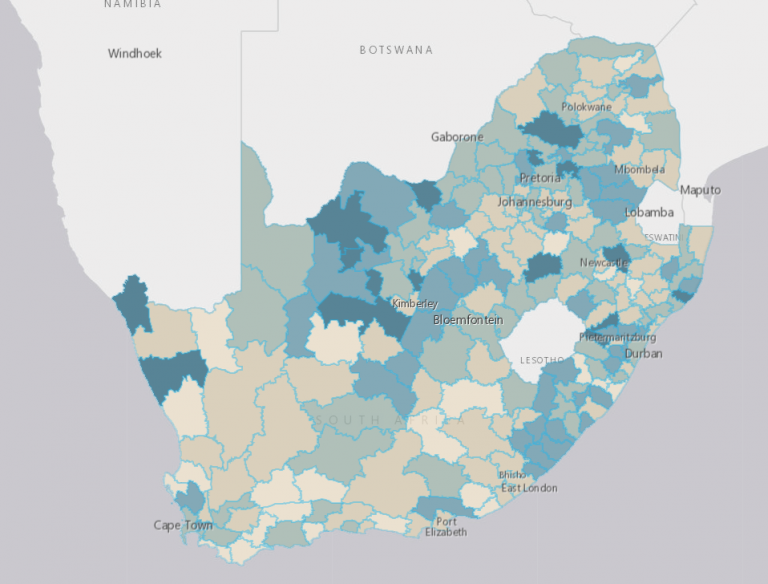
Health and well-being indicators have been identified from publicly available Health Systems Trust (HST), which has more than 250 indicators of delivery of selected healthcare services in the public health sector across the provinces, districts and local municipalities/sub-districts of South Africa. A reformatted version of the 2018/2019 District Health Barometer (DHB) health indicator dataset provided by the HST is available for download.

2. South African Health Subdistrict Boundaries

This dataset demarcates the boundaries of the health subdistricts across South Africa. Health subdistricts were generated in the largest metropolitan municipalities in South Africa including the City of Cape Town, City of Ekurhuleni, City of Johannesburg, City of Tshwane, Mangaung Metropolitan Municipality, Nelson Mandela Bay Metropolitan Municipality. 

3. Waste Water Monitoring

The surveillance of waste water has the potential to play a key role in the management of the COVID-19 pandemic. Wastewater-based epidemiology approach has been successfully used to track infectious diseases such as polio, hepatitis A and the norovirus, and for monitoring drugs and chemical contaminants that could affect human health.

The Water Research Commission (WRC), working with the Waterlab at the University of Pretoria and the CSIR, have already detected Covid-19 RNA signals from several wastewater plants in hot spots in Ekurhuleni, Tshwane and KwaZulu-Natal.

4. Excess Deaths

The South African Medical Research Council receives data on deaths recorded on the National Population Register on a weekly basis. In the context of the emerging COVID-19 pandemic, SAMRC have estimated the number of deaths that have been in excess of what was expected based on the historical data from 2018 and 2019.  Click the link to view. 

5. Archived Infographics

The following infographics have been developed to present an overview of the COVID-19 cases across South Africa and a downloadable version of the District Level Hotspot map that will form the basis of decision-making regarding the national lockdown level. These sets of infographics are no longer updated and have been archived. 

TitleInfographic
District Level Hotspots

Download

About

Partners

A team of leading South African environmental scientists from a range of institutions including SAEON, has been formed under the auspices of the Department of Science and Innovation (DSI) to consider the environmental aspects of the epidemic in the country and region, including weather, climate and air pollution. The main goal of the CERG is to assess confidence regarding the environmental influences, confounders and drivers of the COVID-19 pandemic.

Through a process supported by the South African Department of Science and Innovation and the Department of Health, CERG has been consulting with the epidemiological modelling groups that have been mobilised to assist the South African government in designing and implementing its response strategy to the COVID-19 epidemic.

FAQs

Recent decades have been marked by the emergence of diseases that move from animals to humans. These are known as zoonotic diseases and examples include Ebola, SARS, MERS, West Nile and Rift Valley fevers. Since there is low resistance to these novel diseases, they have had high impacts on infected human populations, and, in the recent emergence of COVID-19, have reached pandemic status. The United Nations ascribes the emergence of these diseases to the destruction of nature, causing the animal carriers of the disease to come into closer and more frequent contact with people as a consequence of loss of their natural habitat. Exploitation of wildlife and destruction of environments, both global change drivers, are driving the emergence of these diseases among people.

Read More

Share this resource: