The South African Risk and Vulnerability Atlas is an open access data platform that unites data to solve complex interconnected problems. SARVA is an initiative of the Department of Science and Innovation and forms a 10-year Global Change Grand Challenge.The Atlas is a living collection of global change resources – including scientific data and long-term observations, static content, references to documentation and reports, and other digital objects.
It is a long established fact that a reader will be distracted by the readable content
SARVA is home to a growing number of themed based atlases that investigate the spatial characteristics of risks and exposure.
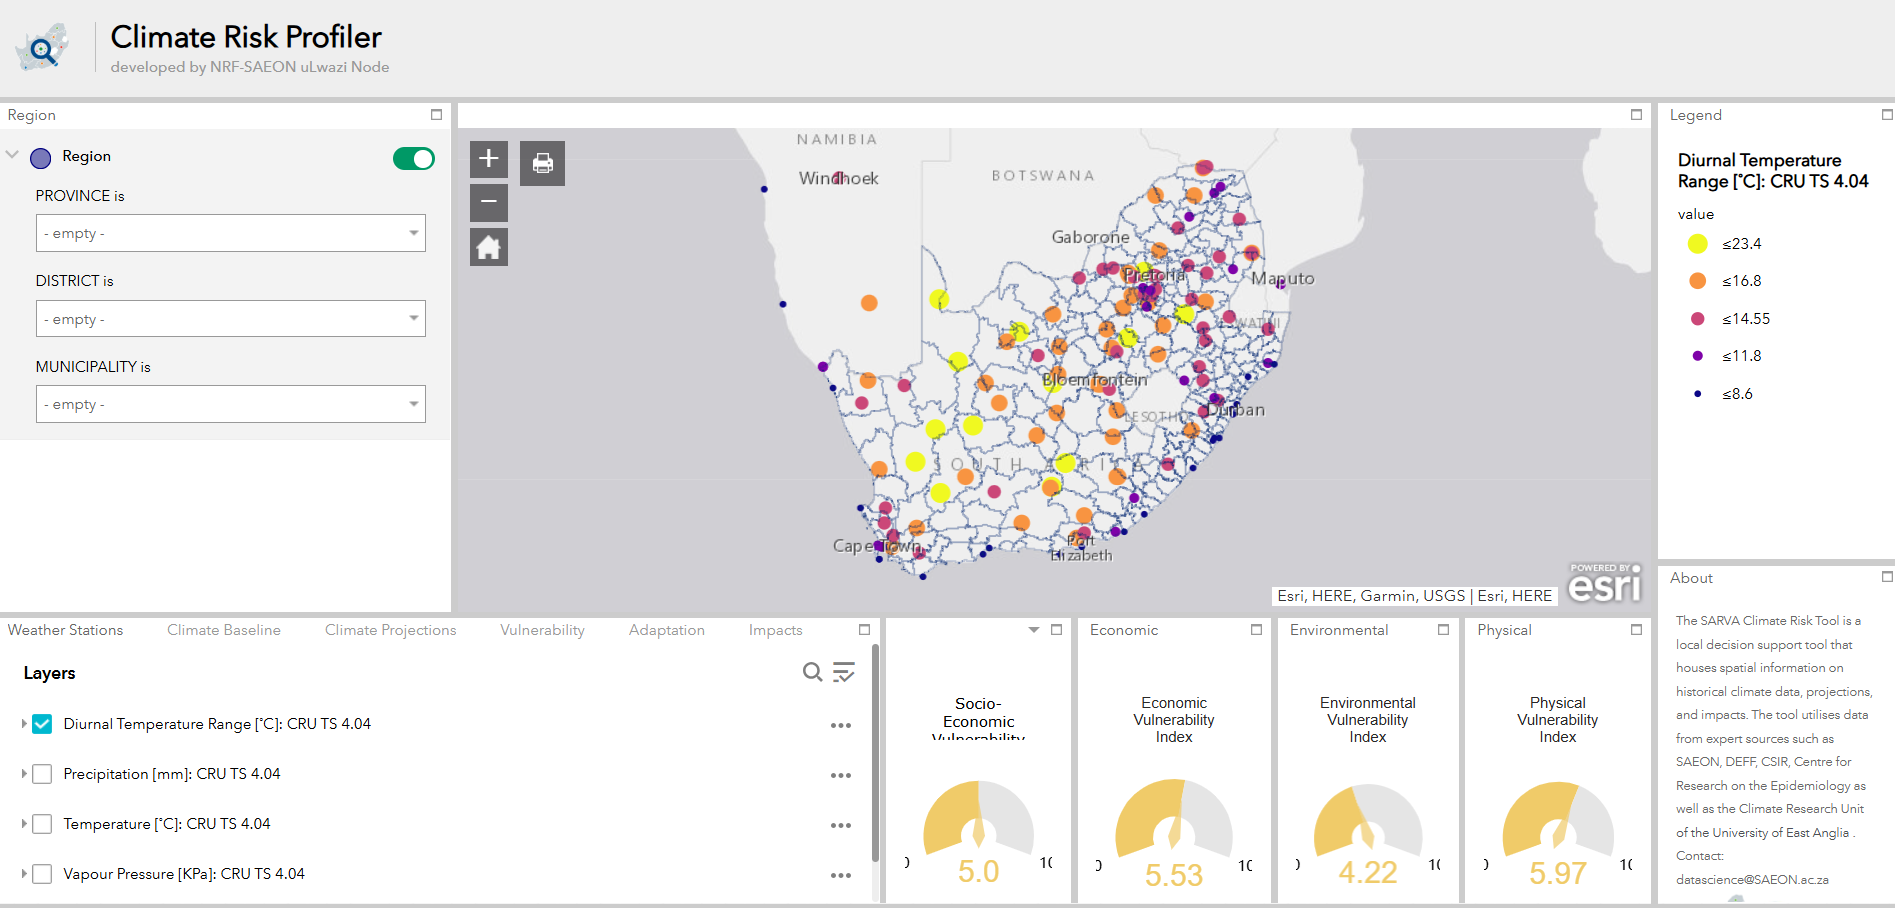
The SARVA Climate Risk Tool is a local decision support tool that provides spatial information on historical climate data, projections, and impacts, using data from expert sources such as SAEON, DEFF, CSIR, the Centre for Research on the Epidemiology, and the Climate Research Unit of the University of East Anglia.
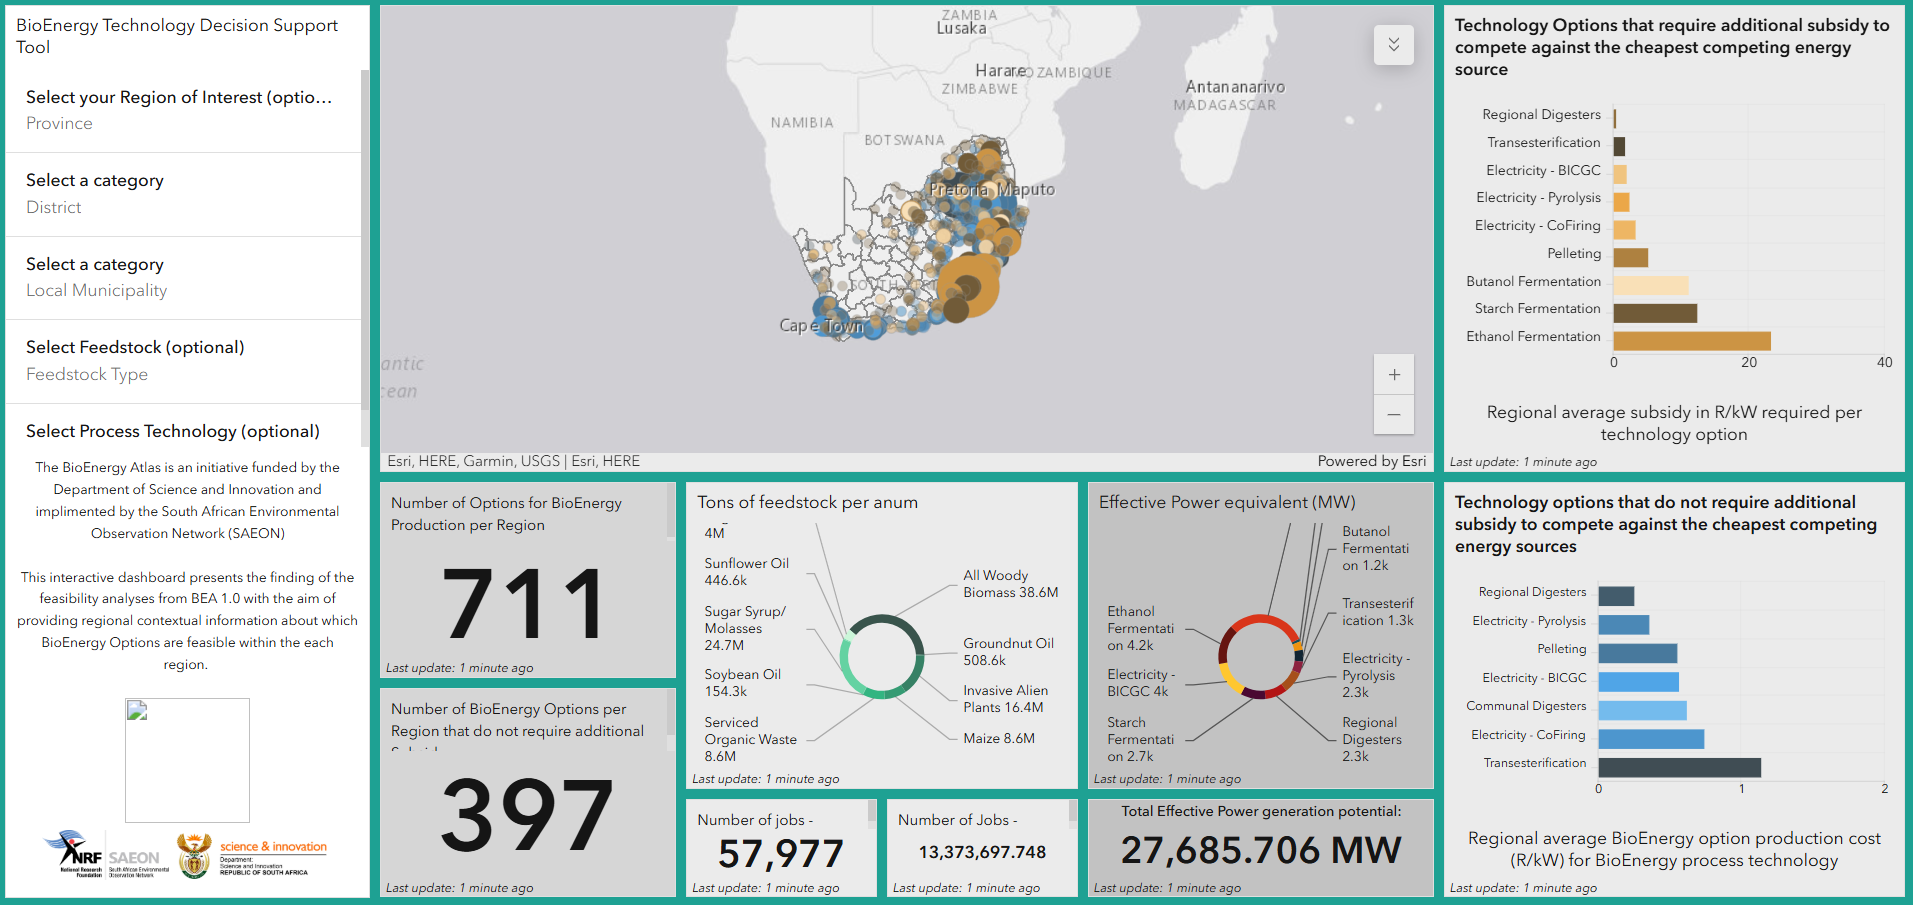
The BioEnergy Atlas is an initiative funded by the Department of Science and Innovation and implemented by the South African Environmental Observation Network (SAEON). This interactive dashboard presents findings from the BEA 1.0 feasibility analyses, providing regional context on which BioEnergy options are viable in each area.
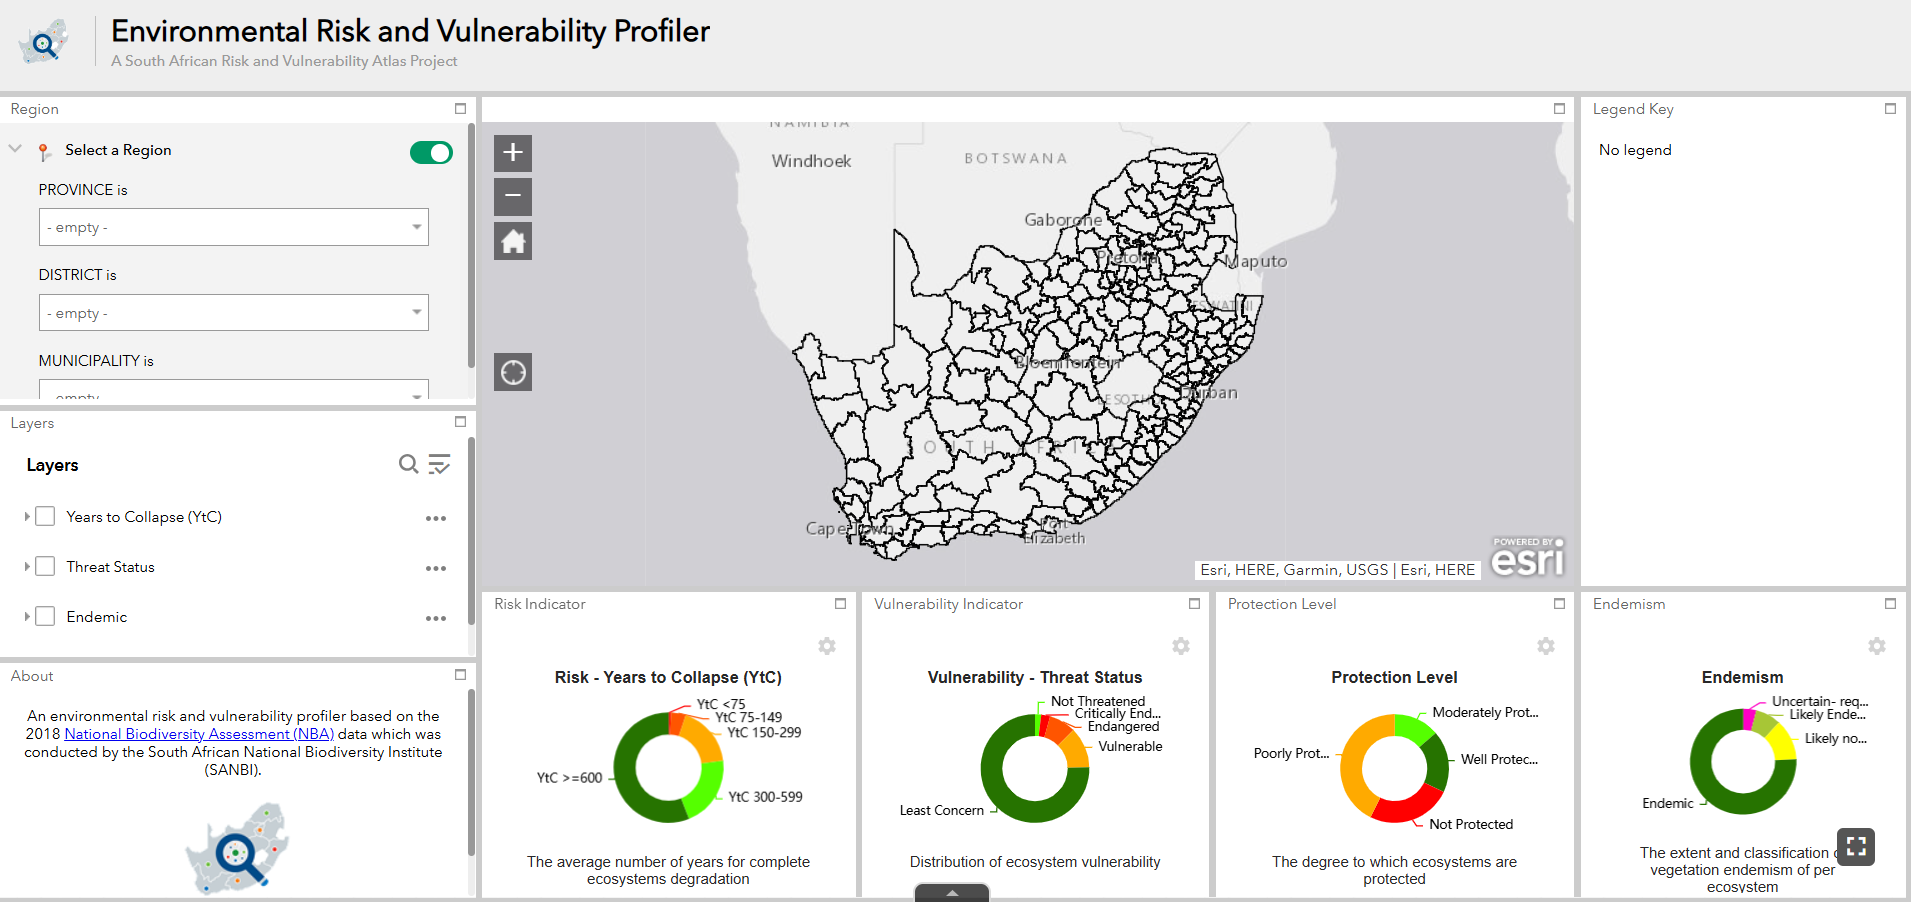
An environmental risk and vulnerability profiler based on the 2018 National Biodiversity Assessment (NBA) data which was conducted by the South African National Biodiversity Institute (SANBI).
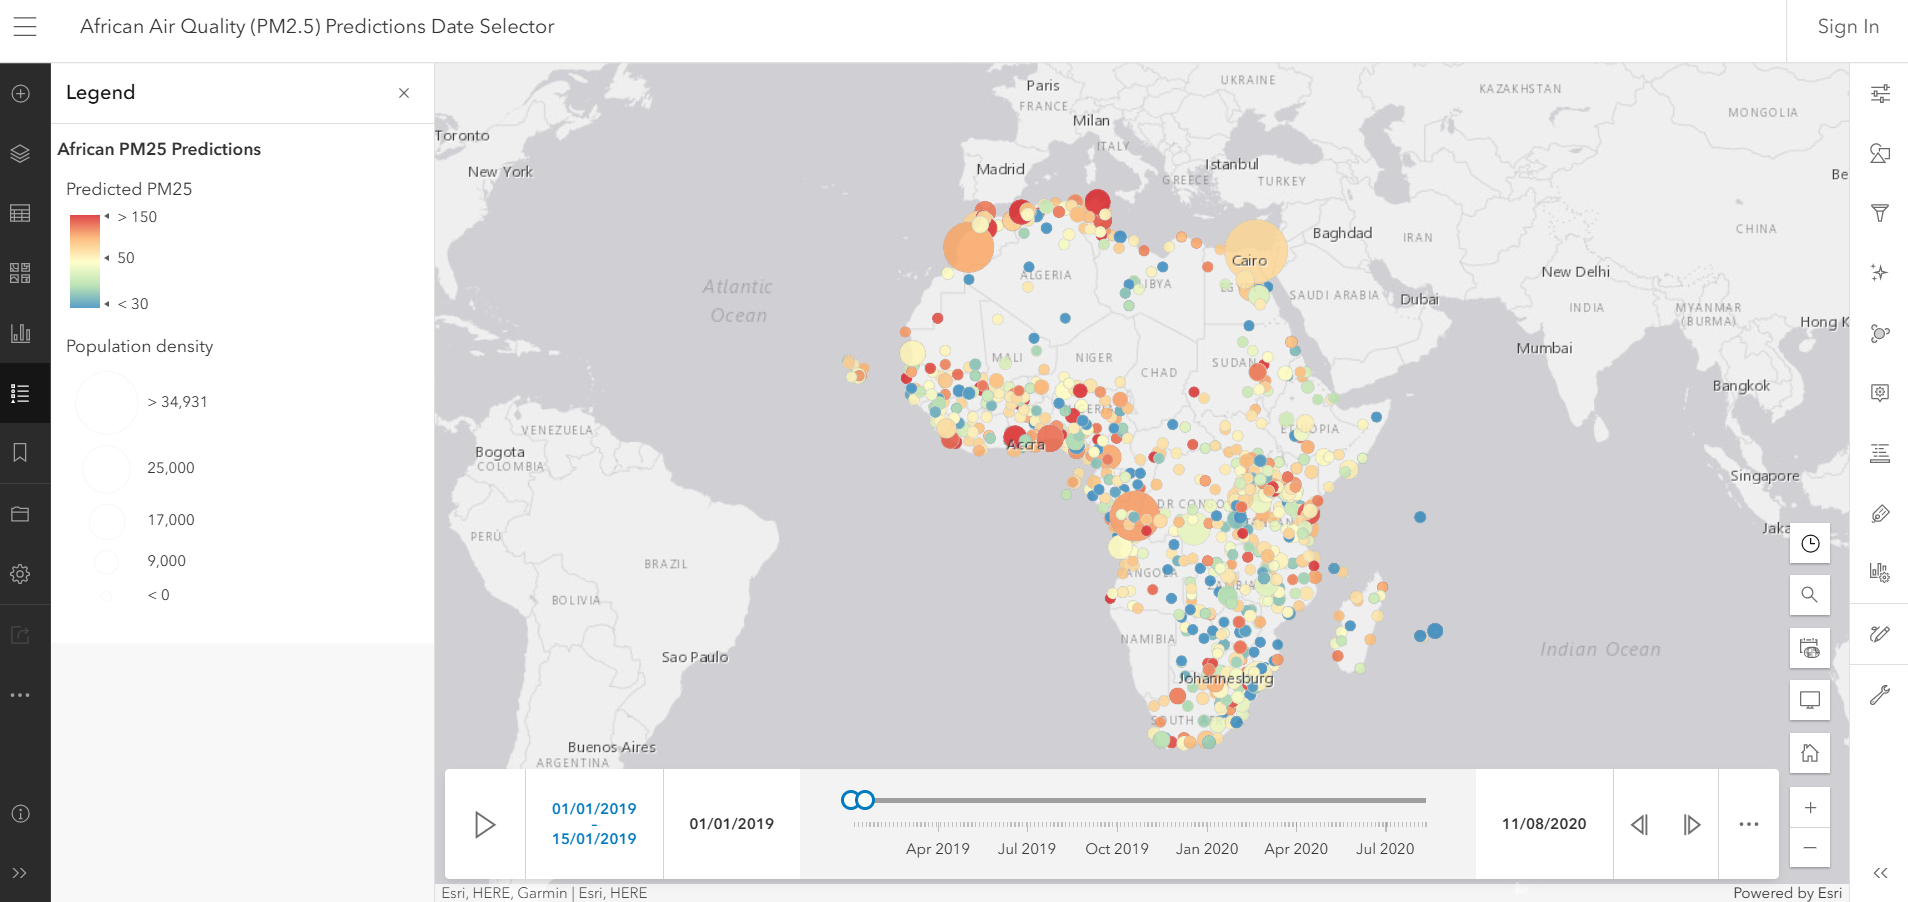
The African Air Quality (PM2.5) Predictions dataset provides daily PM2.5 estimates for 1,466 cities across Africa from 2019 to 2020 to support air quality monitoring and policy development.
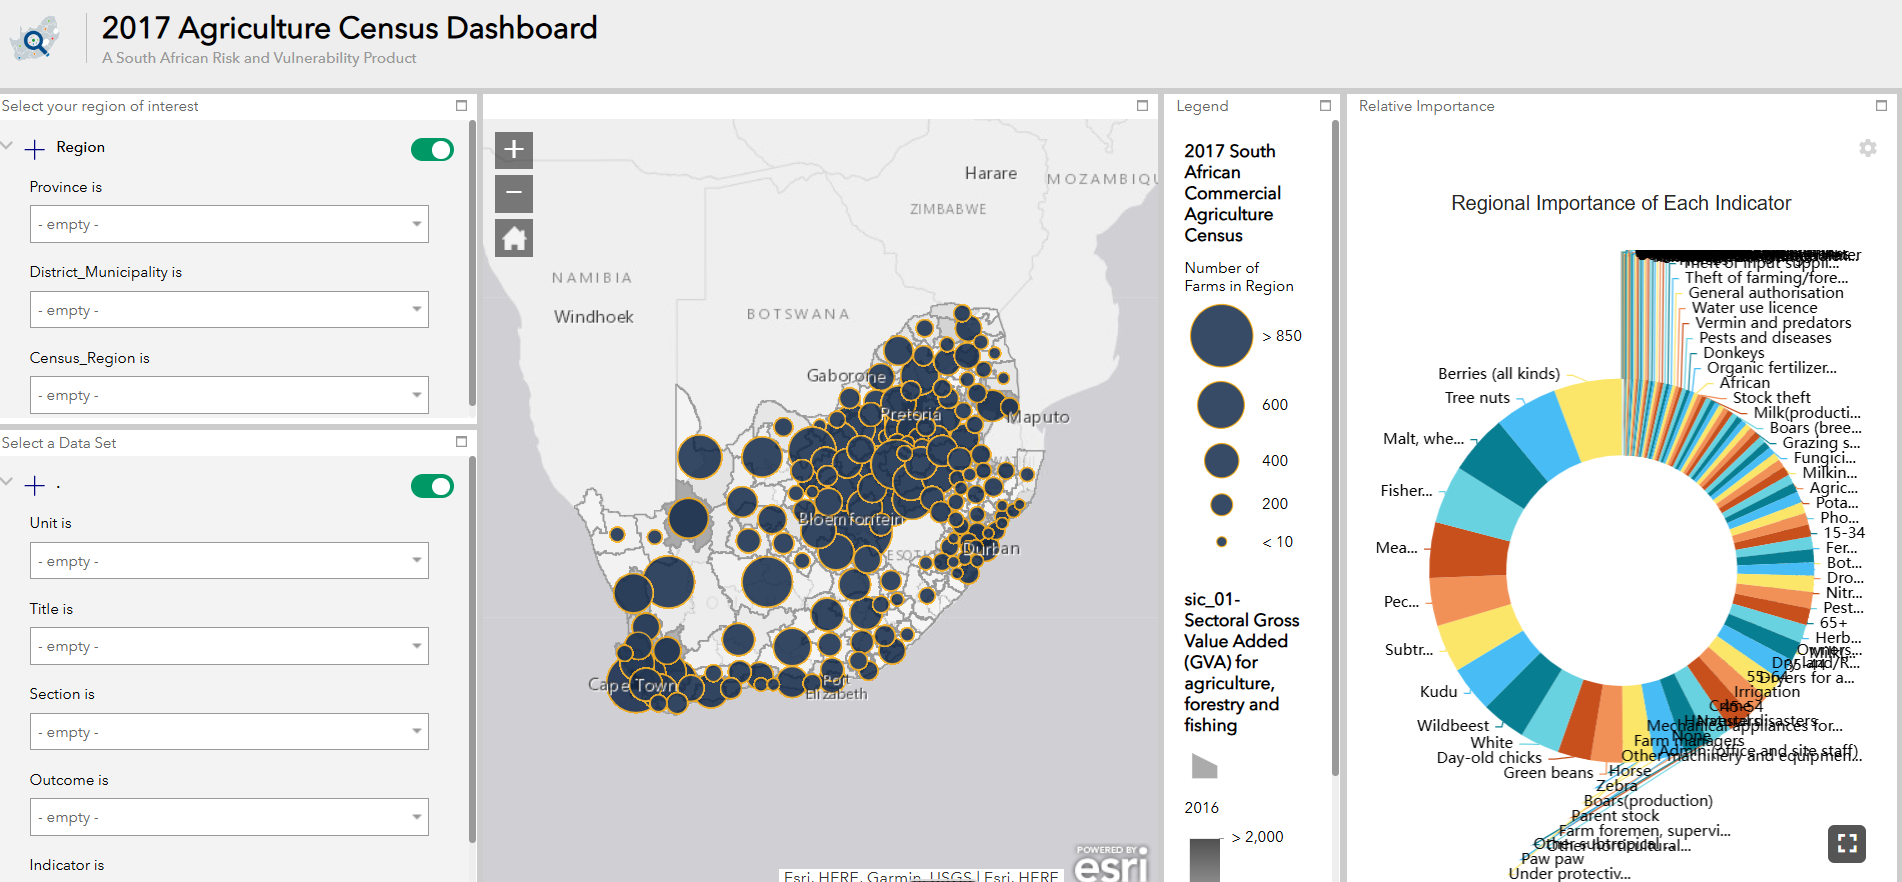
This census is a nationwide survey of commercial agriculture that provides financial and production performance data covering farm ownership, income, land use, and agricultural workforce data.
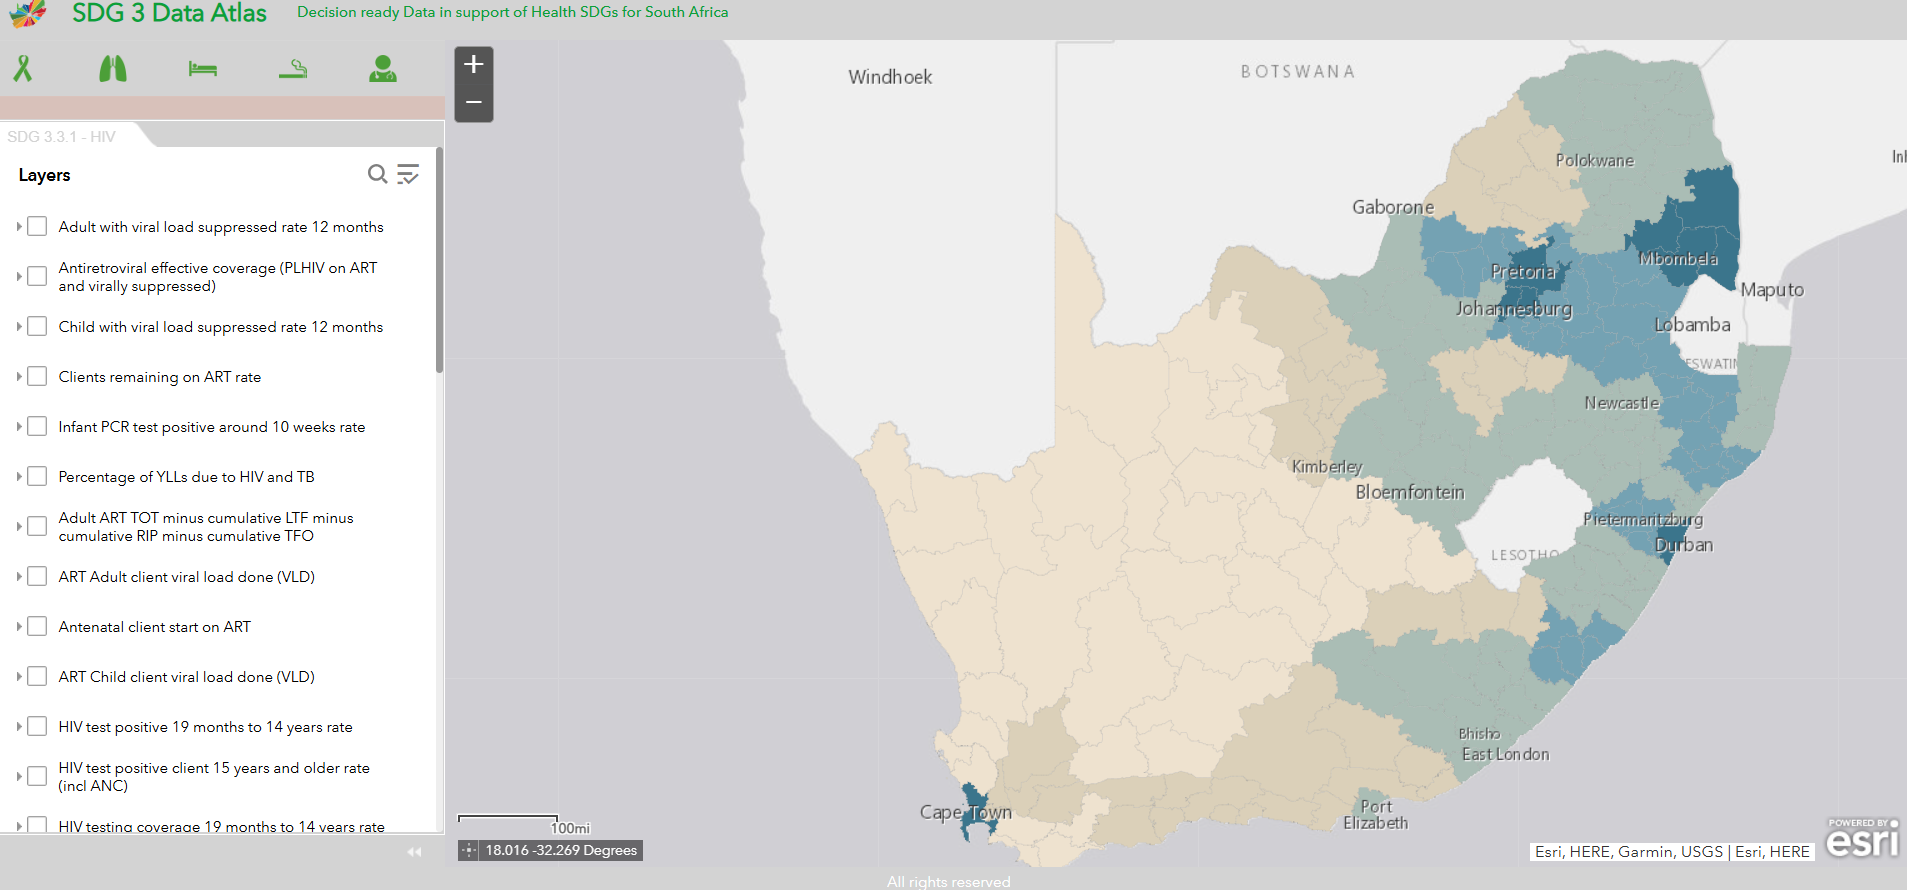
Decision-ready data in support of health SDGs for South Africa. The data provided is at Local Municipality scale and includes data on HIV, TB, non-communicable diseases, smoking, and health care workers.
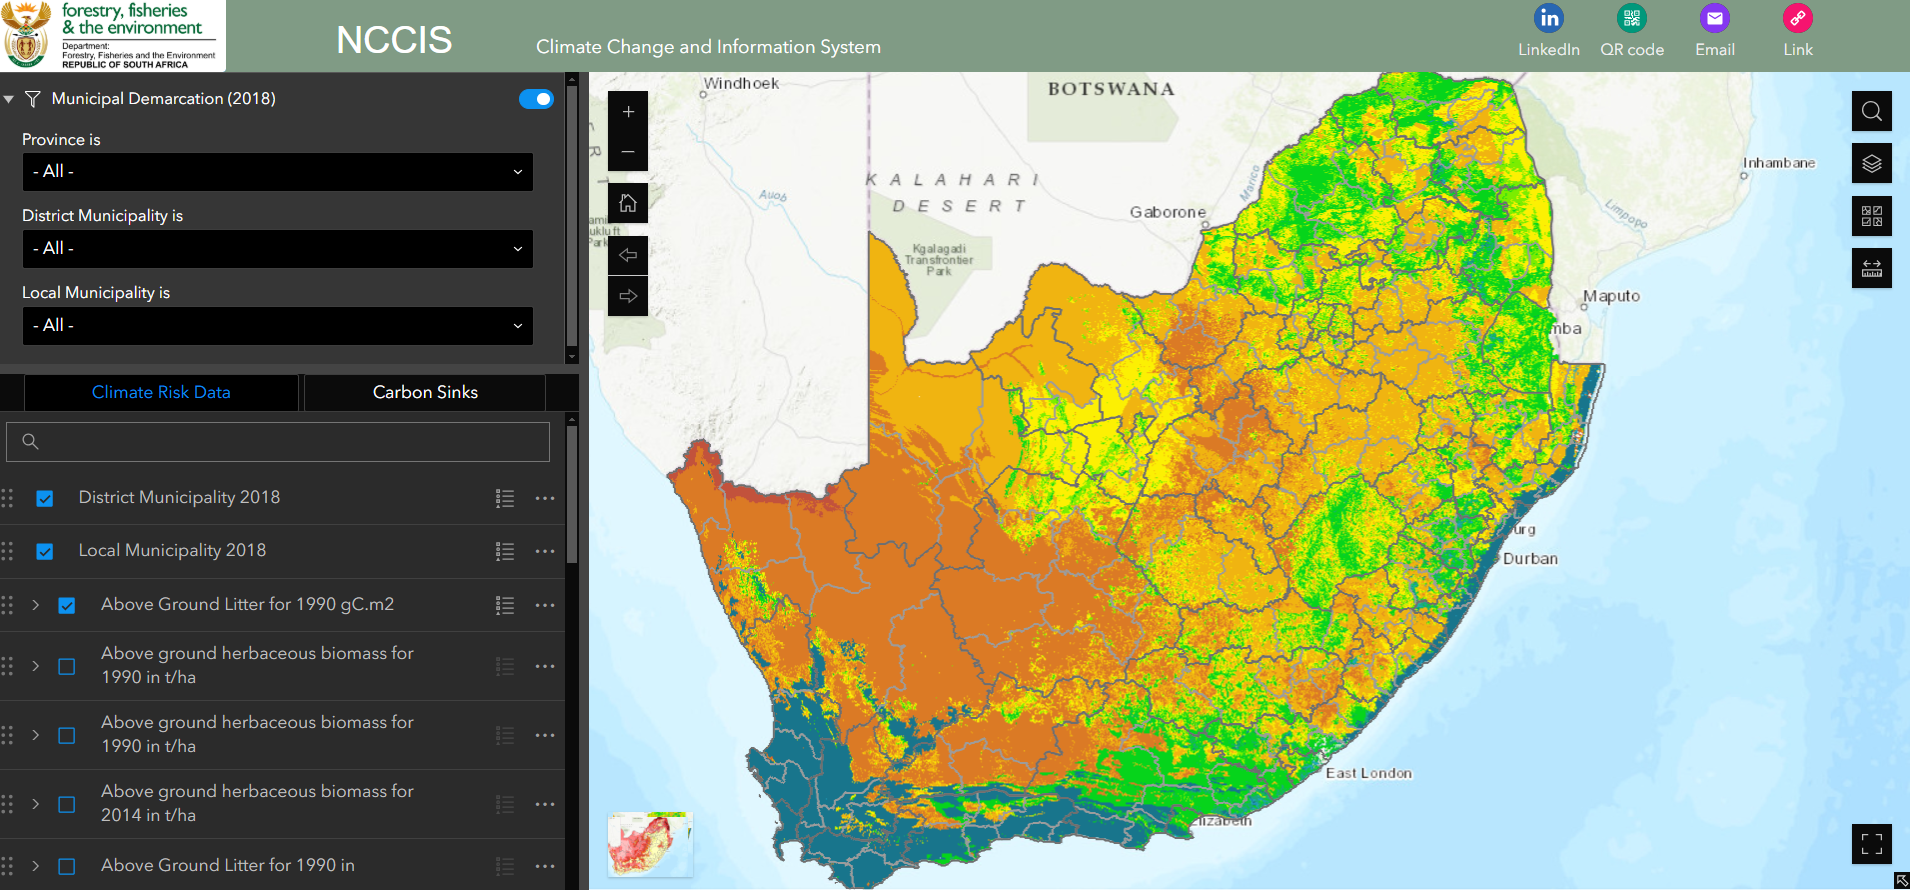
NCCIS contains climate related data and information from a range of sources for the purposes of providing insights into the country’s progress in responding to climate change and achieving SDGs.
This is based on data from the Emergency Events Database (EM-DAT) by CRED, visualizes the number of geophysical, meteorological, hydrological, and climatological natural disaster events across South African from 1952 to 2023
It is a long established fact that a reader will be distracted by the readable content of a page
The South African Risk and Vulnerability Atlas (SARVA) and the South African Environmental Observation Network (SAEON) have developed a comprehensive Climate Risk Report for the Presidential Climate Commission. This report offers an in-depth analysis of South Africa’s climate dynamics, focusing on observed and projected changes in weather patterns and their implications for various sectors.


The district-level Sustainable Development Goal indicator tool links higher spatial and temporal resolution data from a variety of sources to each of the 17 SDGs and associated targets and indicators. We currently have data that covers 15 out of the 17 goals. Click on the SDG logos to view each of the data collections
The world is facing a number of complex global challenges or risks. These include changes in the climate system as well as changes in biophysical and human systems such as urbanisation, deforestation, biodiversity loss and, more recently, the rise of pandemics.
Tracking risks and identifying the susceptibility of communities, settlements, or ecosystems to these risks will assist in building more sustainable economies and societies that are more resilient.
SARVA 3.0 presents the spatial and temporal characteristics of a growing number of risks facing South Africa in order to enable decision-makers to identify vulnerable regions, ecosystems and communities.
SARVA 3.0 provides access to datasets and interactive visualisations of 53 vulnerability indicators that can be used to measure the ability of environmental, economic, and social systems to cope with global change.