South African Risk and Vulnerability Atlas​

MAPPING THE WAY TO A RESILIENT FUTURE​​​

SARVA 3.0

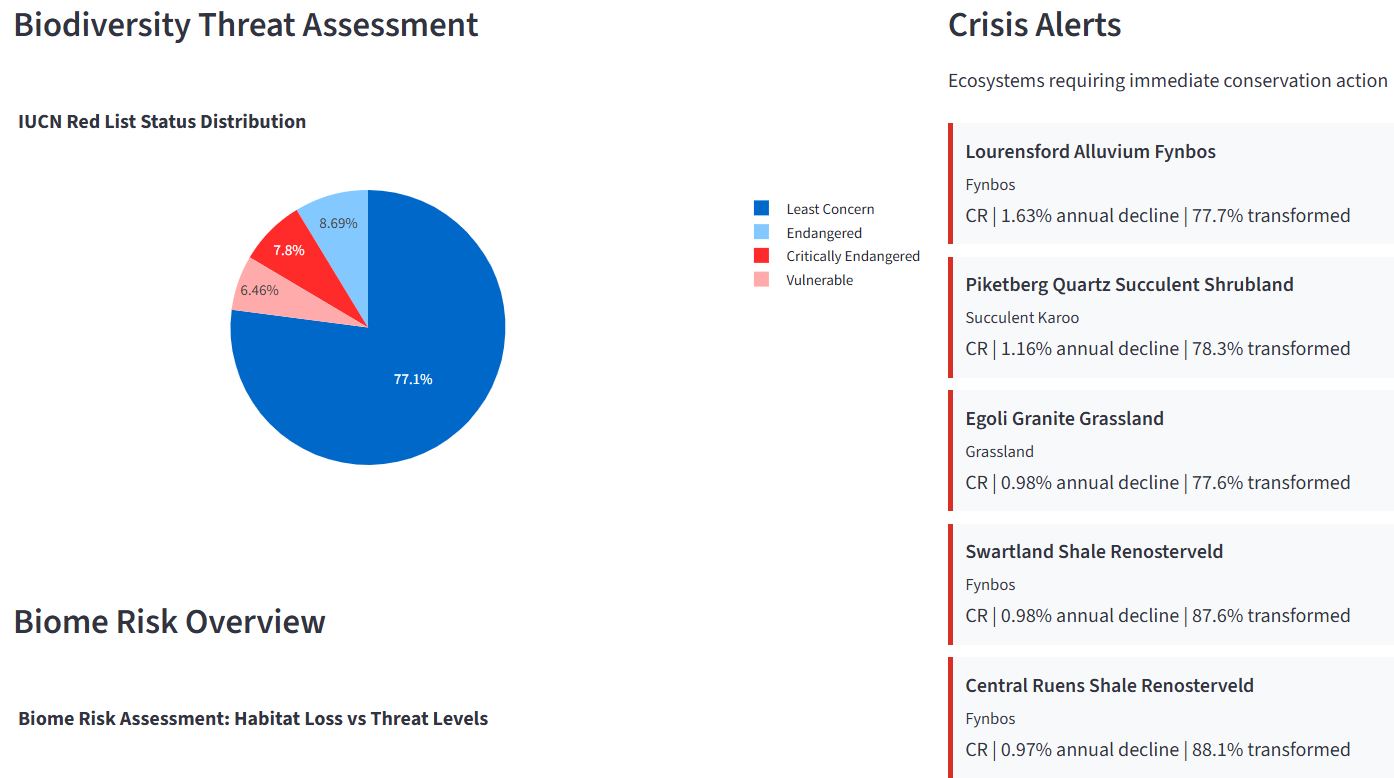
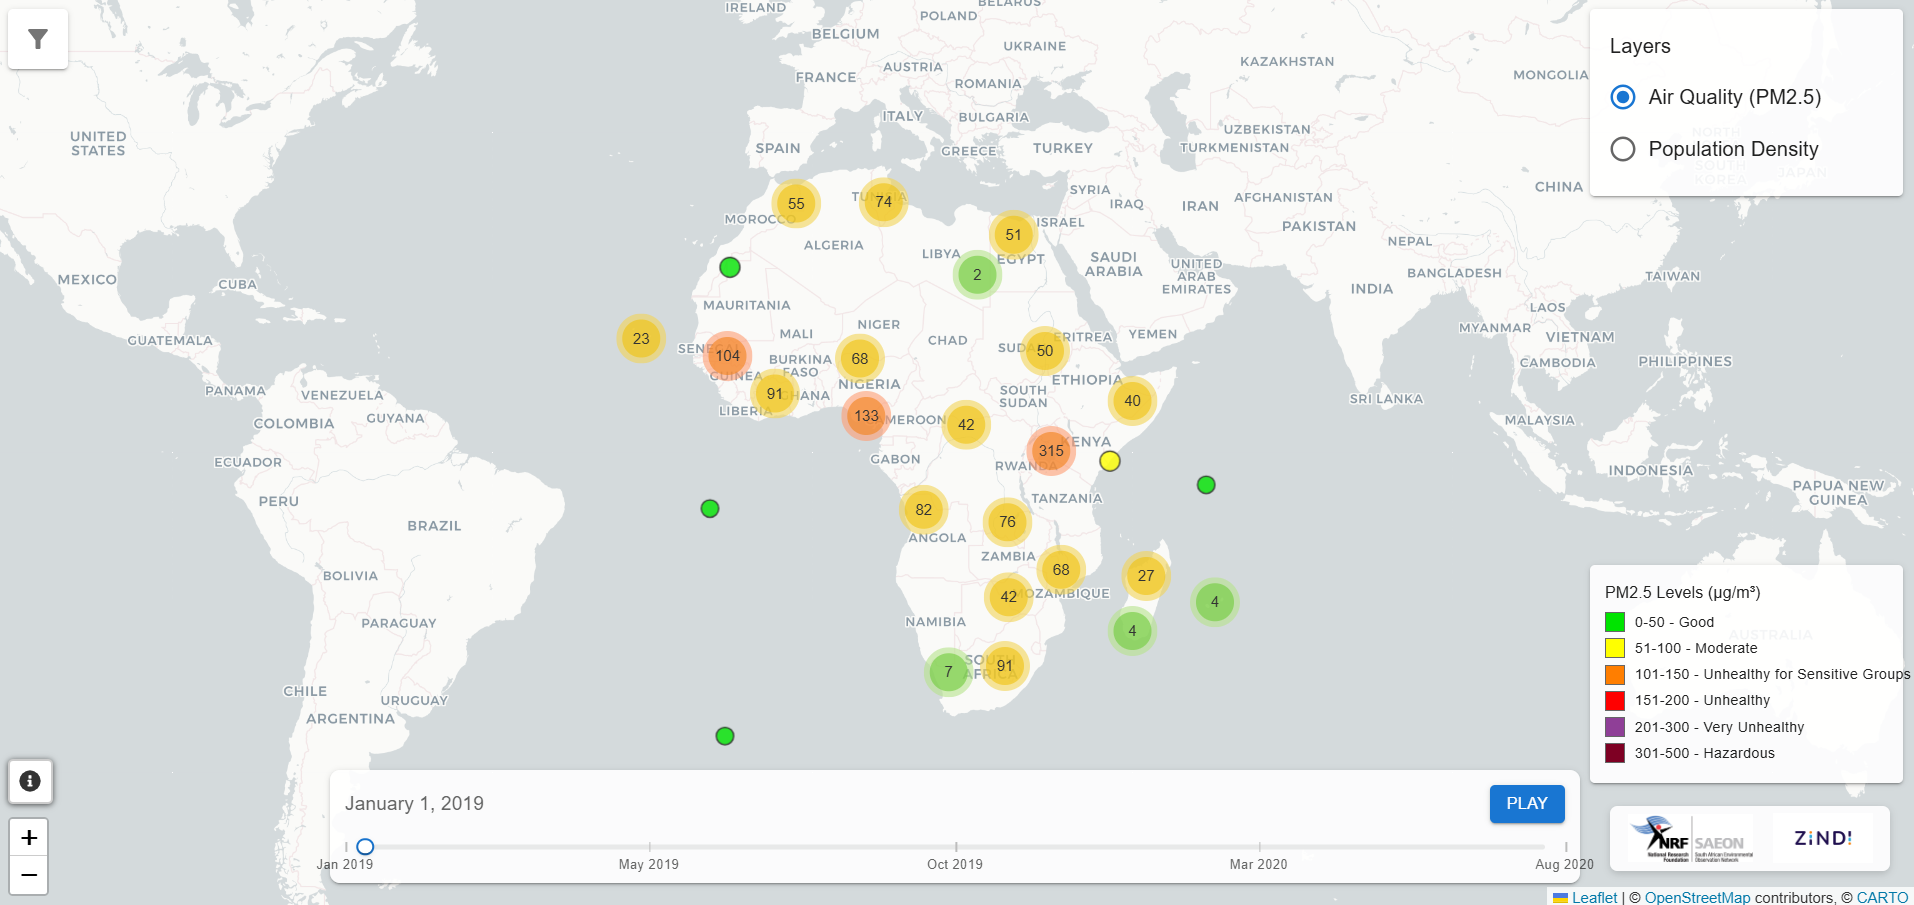
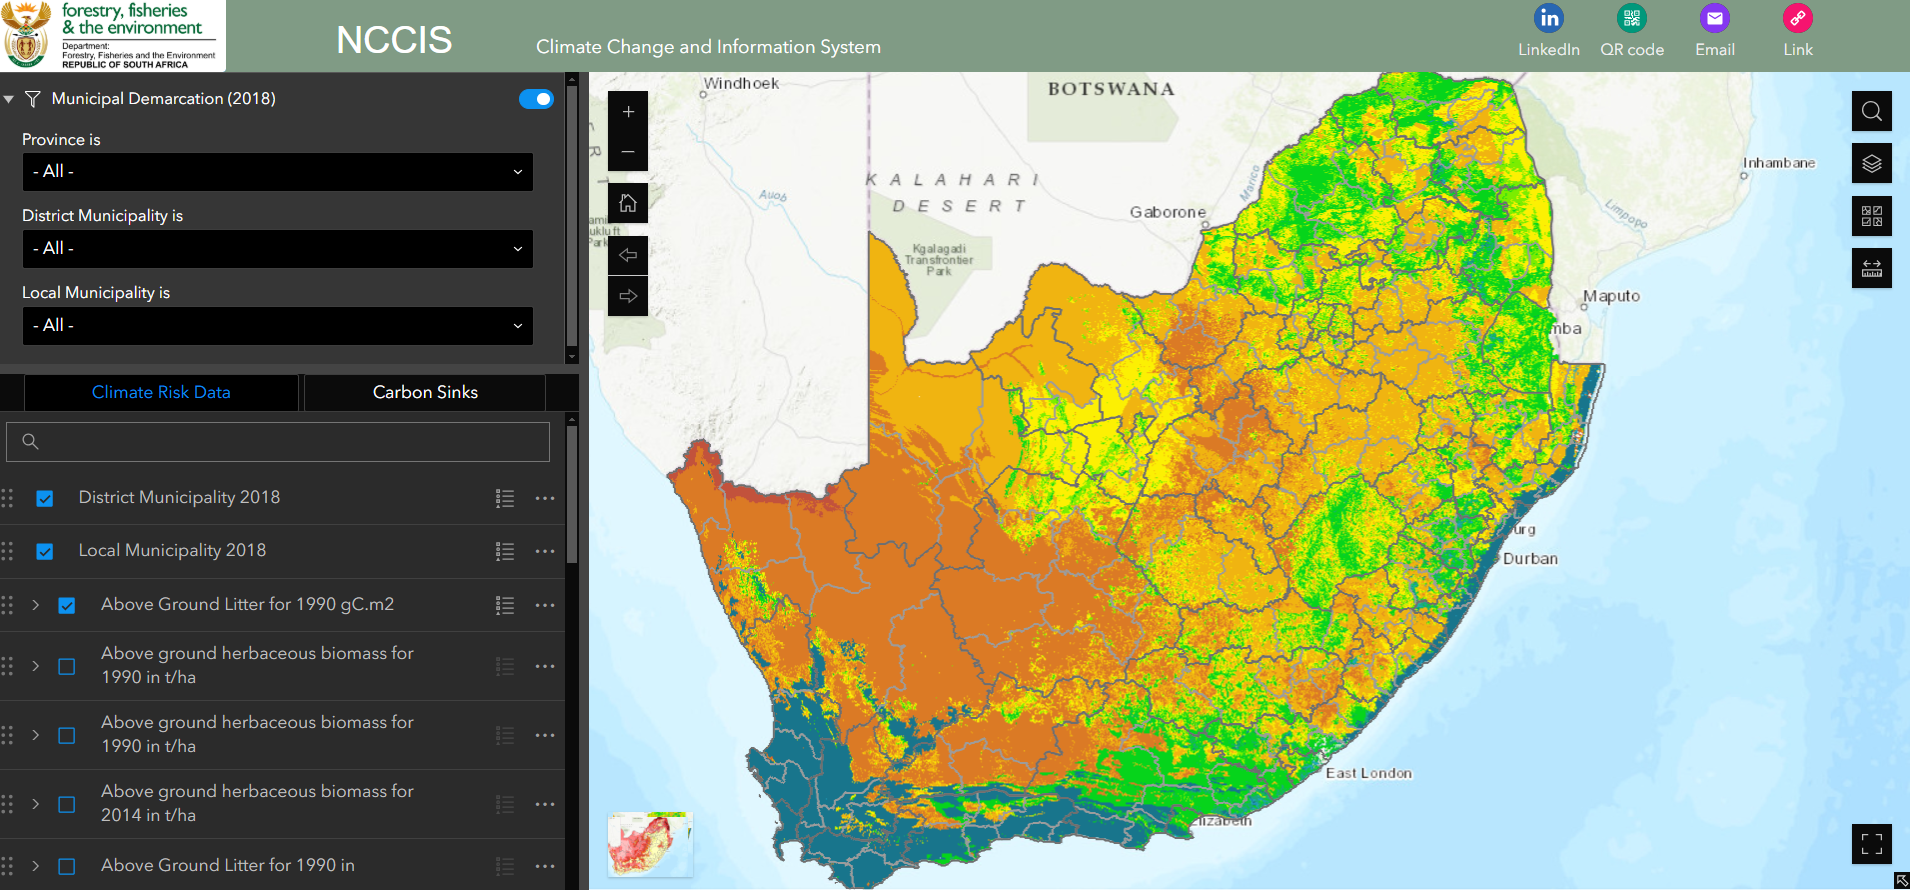
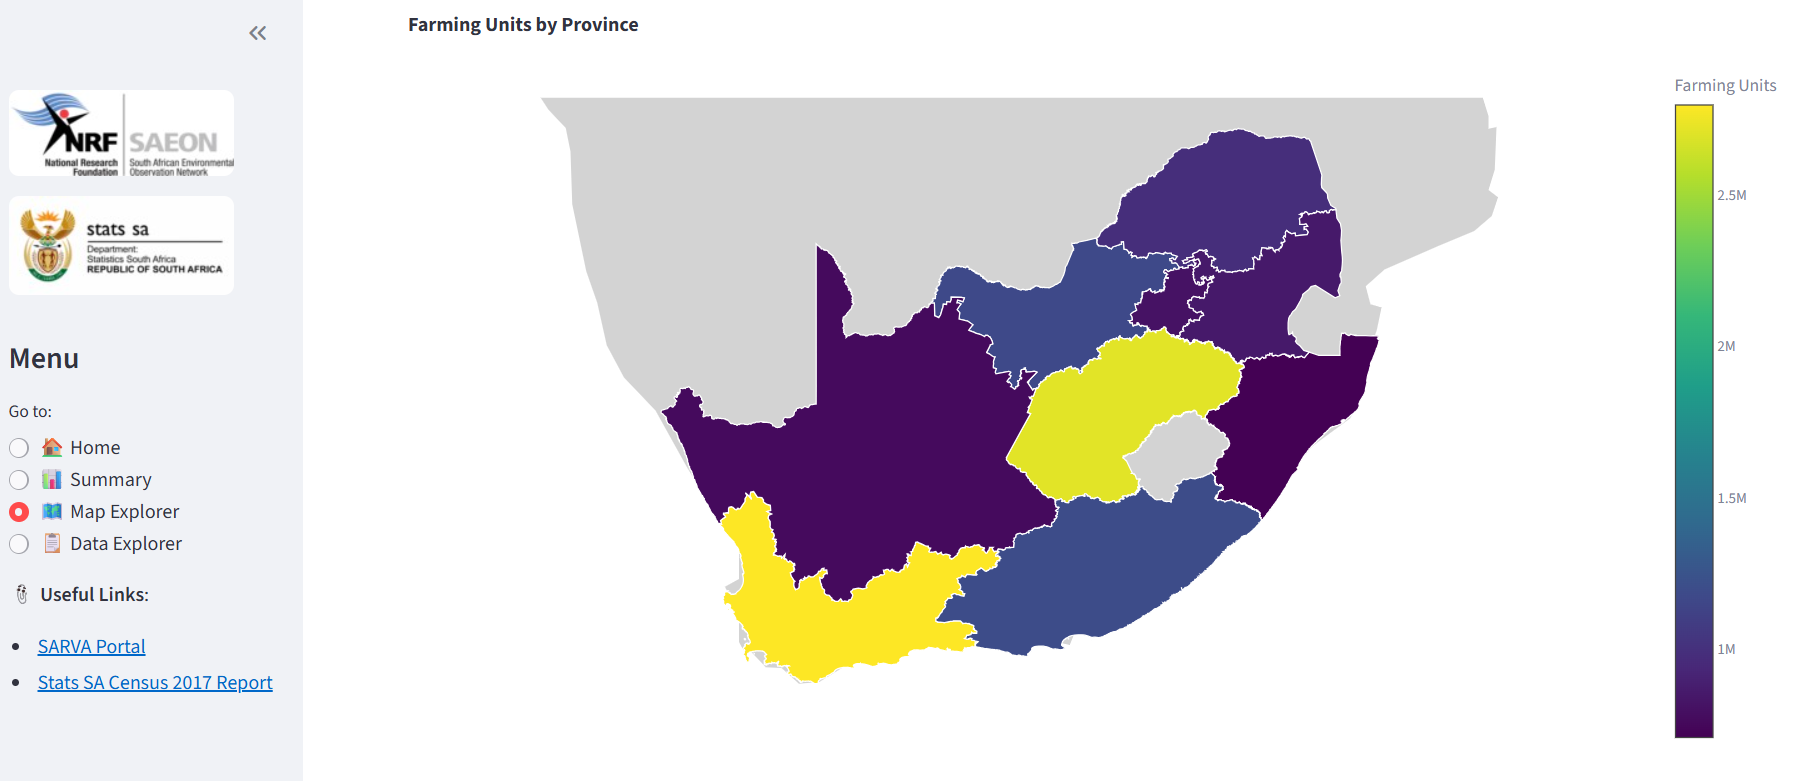
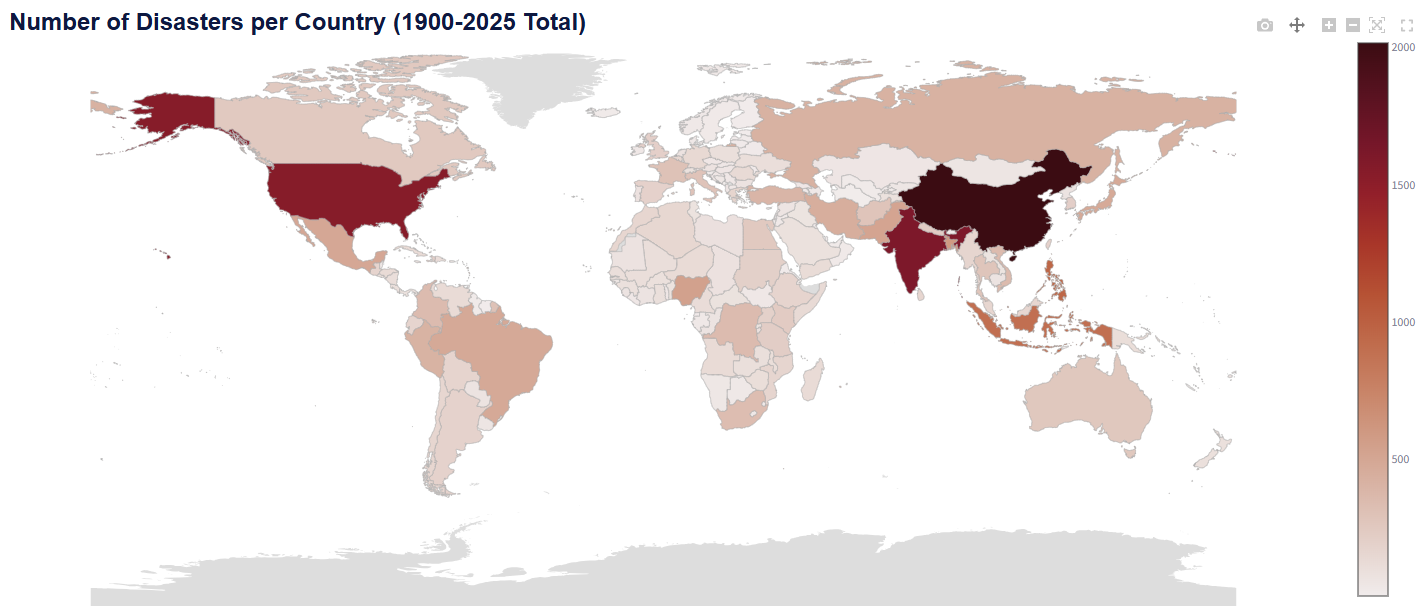
The South African Risk and Vulnerability Atlas is an open access platform that unites data to solve complex interconnected problems. SARVA is a living collection of global change resources – including scientific data and long-term observations, static content, references to documentation and reports, and other digital objects.

SARVA is an initiative of the Department of Science and Innovation and forms a 10-year Global Change Grand Challenge. It is currently in its third phase of implementation. 

0
Open Datasets
0
Risk Profiles
0
Vulnerability Indicators
0
SDG Indicators Linked to Data

Featured Data

Downscaled climate change projections for Mpumalanga Province
SDG 13
Metrics Available include:
  • Agricultural drought as indicated by the consecutive dry days (cdd) index
  • Flooding as indicated by the consecutive wet days (cwd) index
  • Diurnal temperature range (dtr)
  • Number of precipitation days > 20mm (r20mm)
  • Maximum 5day precipitation > 5mm (rx5day)
  • Monthly maximum of daily min temperature (tnx)
  • Monthly maximum of daily man temperature (txx)
South African Census of Commercial Agriculture
SDG 2: Indicator 2.4.1

The 2017 Agriculture Census produced by the Department of Statistics South Africa  is a country-wide census of commercial agriculture and includes variables such as the type of farm ownership, production land, agricultural products, and agricultural losses,

Daily air quality estimates for urban centers in Africa
SDG 11: Indicator 11.6.2

This dataset contains daily estimates of PM2.5 particulate matter in 1466 cities across Africa as well as an additional 496 smaller population clusters in South Africa.

South African hazardous events mortalities data
SDG 1: Indicator 1.5.1D

Supporting data for – Davis-Reddy, Claire & Hilgart, Amelia. (2021). Towards an interoperable National Hazards Events Database for South Africa. Frontiers in Climate. 

Terrestrial Environment Data
SDG 15

A curation of a collection of publications, reports, spatial datasets and spreadsheets of terrestrial datasets. The collection contains 252 open datasets published in the SAEON catalogue.

Population Living in Poverty
SDG 2: Indicator 1.2.1

The dataset shows estimates of the total population living in poverty. The data was allocated to mesozones by combining with a base mesozone layer. The estimate is a sum of income levels below the upper bound poverty line. 

Risk and Vulnerability

The world is facing a number of complex global challenges or risks. These include changes in the climate system as well as changes in biophysical and human systems such as urbanisation, deforestation, biodiversity loss and, more recently, the rise of pandemics.

Tracking risks and identifying the susceptibility of communities, settlements, or ecosystems to these risks will assist in building more sustainable economies and societies that are more resilient. 

Risks

SARVA 3.0 presents the spatial and temporal characteristics of a growing number of risks facing South Africa in order to enable decision-makers to identify vulnerable regions, ecosystems and communities. 

Vulnerability

SARVA 3.0 provides access to datasets and interactive visualisations of 53 vulnerability indicators that can be used to measure the ability of environmental, economic, and social systems to cope with global change. 

Sustainability

The district-level Sustainable Development Goal indicator tool links higher spatial and temporal resolution data from a variety of sources to each of the 17 SDGs and associated targets and indicators. We currently have data that covers 15 out of the 17 goals. Click on the SDG logos to view each of the data collections